
Over the last couple of decades, we have built up RFI Global based on our ability to offer banks and other financial institutions the actionable insights they need to understand their customer bases and to stand out against their competitors.
In this time, the metric that has risen to the top when it comes to measuring customer experience is the Net Promoter Score (NPS). The NPS score is derived from answers to the simple question “On a scale of 0-10, how likely are you to recommend XXX to a friend or colleague?”
RFI is privileged to provide NPS tracking and analysis to many of the world’s largest and most valuable banking brands. We have the pleasure of working with leading banks worldwide, supporting them in achieving standout NPS scores and helping them turn customer advocacy into measurable impact.

Going global
In our digital age, the world has shrunk, and it is inevitable that these same institutions want to compare themselves, not just to domestic competitors, but to global standards. And our clients are increasingly asking for this global view.
With local market expertise and a global reach, RFI is well placed to provide a global perspective. We’ve collected data about financial behaviour over the last 19 years from more than 40 countries on an ongoing basis. We conduct over 200,000 consumer interviews and 60,000 business interviews globally for leading financial services institutions each year.
This gives us the ability to compare on a country-by-country basis and by brand across borders.
The devil is in the details
When it comes to benchmarking, it pays to make sure that you’re comparing apples with apples so that any conclusions have a grounding in the real world.
For example, some cultures tend to use the extreme ends of the scoring scale, while others prefer the middle range, and this makes comparisons of absolute NPS numbers very tricky.
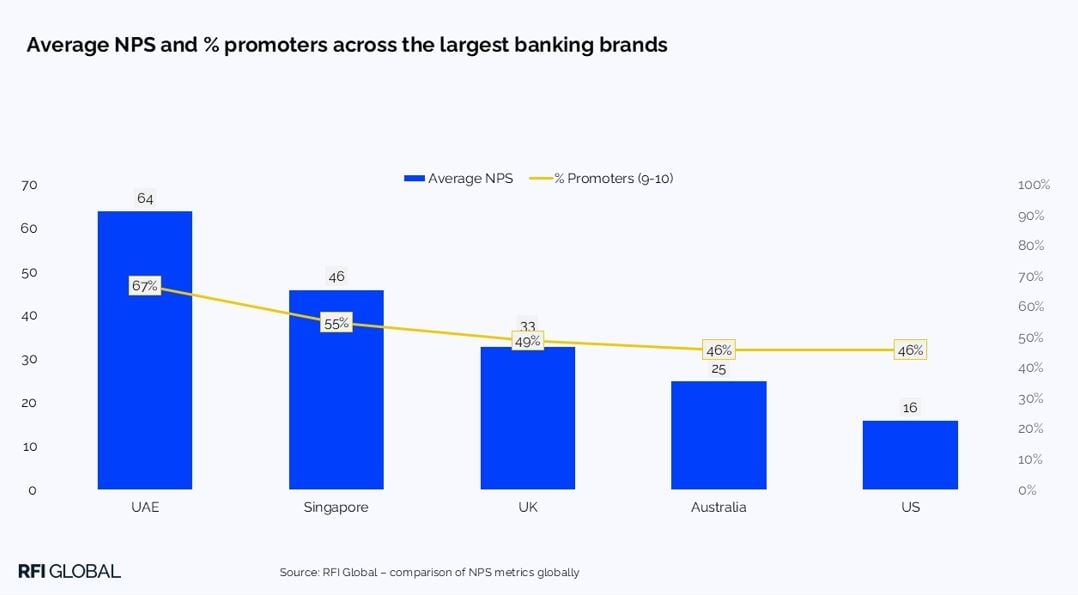
To put this into perspective, if we look at the UAE, the proportion of customers who score their bank as a promoter (9 or a 10 on the 0-10 scale) is 67%, whereas in the US, this figure is just 46%. As a consequence, when we look at the largest banks in these markets, there is a marked difference in the NPS scores, +64 in the UAE on average vs +16 in the US. Is it fair to say that US banks, on average, perform much worse than those in the UAE? Not to this degree.
Equally, one could argue that it pays to compare similar categories of banks. Is it relevant to compare the NPS of a digital-only bank to that of a full-service bank that has a legacy of branches and face-to-face servicing expectations? Or should we compare customer-owned institutions (mutuals, building societies and credit unions) that have a community feel with listed banks? I would argue no, and that we should be careful where we focus our lens.
If you ignore this, then you might end up comparing brands that have very little in common. For example, we might conclude that it is viable to compare the US market to the UK or Australia. In both the UK and Australia, the highest performing banks are digital-only NEO banks (with NPS of +50 and +69, respectively), whereas in the US, it is an armed forces-centered credit union that leads the way (with +67).
Comparing NPS of organisations across these markets is therefore decidedly tricky.
What lies beneath NPS
Taking into account these considerations, one might conclude that it’s simply not worth comparing across categories and across markets when it comes to NPS. However, I believe that would be rash.
While absolute NPS is not necessarily comparable, I’ve always regarded the ‘number’ as a byproduct of the important stuff that lies beneath it. These underlying drivers of NPS are what provide us with some fantastic insight and give us a window into why certain brands are doing well (or not).
For example, if we look across the markets in the chart above, despite the fact that we don’t necessarily want to compare them through the absolute NPS numbers, some themes correlate highly with good NPS results. And these are very comparable.
Key drivers of NPS globally
These factors fall into the top 10 drivers of NPS in each market:
- Honesty, trust and fairness
- Availability and accessibility of information/ staff
- Brand and reputation that aligns with my values
- Availability of digital tools that enable me to help myself
It’s interesting to consider these in the context of the challenges banks face. Challenges that are often conflicting, such as “how do we keep customers that want to interact with us through traditional channels happy in an environment when we’re transitioning to a digital-first model?”, or “how do we make sure we give customers granular enough capability, insight and services that they can do what they want to do and feel valued while they do it?”
These are big challenges that almost every banking organisation is grappling with to a degree.
How to compare NPS across markets
Ultimately, to make the best use of global NPS data, rather than comparing absolute numbers, a bank should:
1. Identify the comparable brands it seeks to emulate, and
2. Identify aspirational brands from the global competitor set that may be doing unique things
Then…
3. Understand how those brands are tackling the common challenges above
And…
4. Identify specifically how these relate to the top factors that underly NPS.
If a bank can do this, then it can learn from the global benchmarks and leverage them to improve its NPS. This takes NPS comparison beyond a vanity exercise and into real-world pragmatism.
Don’t know how to identify the best brands to learn from? Get in touch, RFI Global can help.
Data-driven insights for financial service leaders
Subscribe to The Banknote, our monthly newsletter delivering expert perspectives and exclusive analysis, powered by 200,000 consumer and 60,000 business interviews each year to help you stay ahead in a fast-changing financial world.